Analyzing the Commodity Flow Survey: Insights into U.S. Shipments
The Commodity Flow Survey (CFS), conducted by the U.S. Census Bureau, provides a comprehensive overview of freight shipments across the nation. According to the latest estimates released, U.S. shipments reached 12.2 billion tons in 2022, a statistic that reflects the dynamic nature of our economy and the logistics industry.
Increase in Shipment Value
One of the most striking findings from the CFS is that the total value of shipments increased by a substantial $3.5 trillion, representing a growth of 24% over a five-year span. This brings the total value of shipments to $18.0 trillion—a significant figure that underscores the importance of freight logistics in driving economic growth. It’s important to note that these values are not adjusted for inflation or seasonality, which makes them particularly relevant for understanding real-time economic conditions.
Modes of Transportation
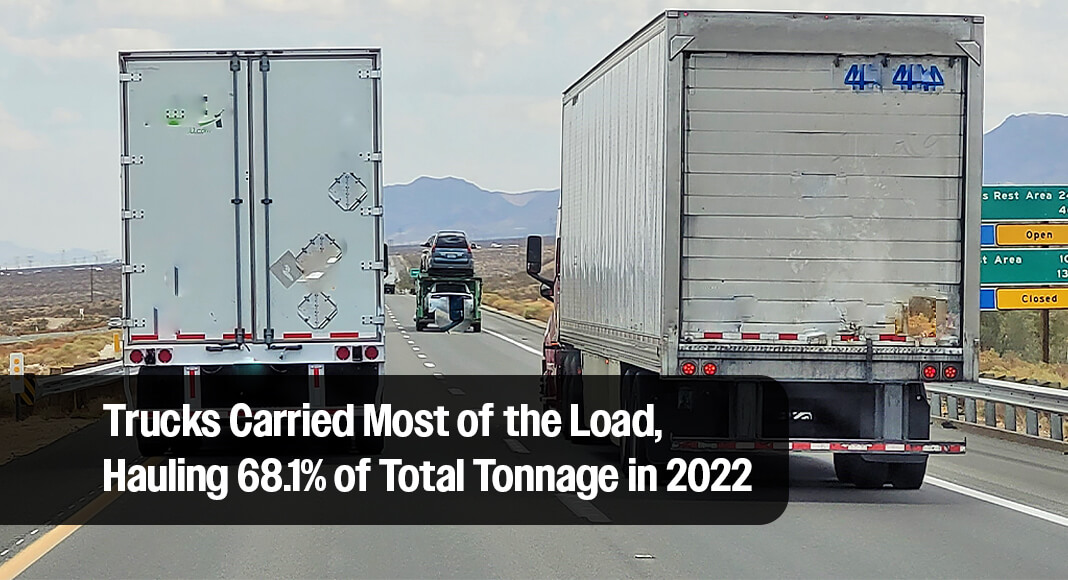
Trucking remains the dominant mode of transportation, accounting for approximately 68.1% of the total tonnage shipped. In fact, trucks carried around 8.3 billion tons of goods in 2022, valued at an impressive $13.2 trillion, which represents 73.5% of the total shipment value. This highlights how essential trucking is to the U.S. freight system, efficiently linking producers to consumers over both short and long distances.
Interestingly, new data revealed that Customer Pickup accounted for 1.4 billion tons of shipped goods, valued at $1.0 trillion. This mode reflects changing consumer behaviors, where individuals are increasingly opting to collect goods themselves, particularly in the age of e-commerce.
Regional Insights
A geographical analysis reveals that the South region led U.S. shipments, moving 1.9 billion tons of goods, worth $6.7 trillion. The Midwest closely followed, with 3.4 billion tons valued at $4.8 trillion. The statistics reveal regional strengths in particular sectors, providing critical data for policymakers and businesses.
Manufacturing and Wholesale Establishments
Manufacturing establishments were significant contributors, shipping 4.9 billion tons of commodities worth $7.1 trillion. Meanwhile, wholesale establishments moved around 4.1 billion tons, valued at $8.1 trillion. These figures highlight the central role of both manufacturing and wholesale in the U.S. economy and how they shape freight movements.
Short-Distance Shipping Trends
Approximately 56.4% of all tonnage shipped traveled less than 50 miles in 2022, indicating a trend toward local and regional shipping. This trend is vital for understanding how goods are transported within states and urban areas, affecting everything from supply chain management to local economic activity.
Hazardous Materials
The CFS also sheds light on how hazardous materials are handled in freight logistics. In 2022, shipments of hazardous materials weighed around 2.6 billion tons, valued at $2.1 trillion. This category of goods requires special attention due to safety risks, regulatory requirements, and public health considerations, emphasizing the importance of effective logistics solutions.
About the Commodity Flow Survey
Established in 1993 and conducted every five years since 1997, the Commodity Flow Survey serves as a fundamental research tool in understanding national freight dynamics. It’s a collaboration between the Census Bureau and the U.S. Department of Transportation’s Bureau of Transportation Statistics. The survey collects vital statistics on the origin and destination, value, weight, mode of transportation, and distances of commodities shipped across the United States.
The CFS plays a pivotal role in assisting policymakers and transportation planners in assessing demands for transportation infrastructure, understanding energy use, evaluating safety risks, and addressing environmental concerns. With a sample of approximately 165,000 establishments, it delivers reliable insights into freight activities across various industries.
Exclusions and Limitations
It is crucial to note that the Commodity Flow Survey does not include establishments in sectors like forestry, fishing, utilities, construction, transportation, and many retail and service industries. Additionally, the survey does not account for import activities unless they pass through a sampled establishment. Understanding these limitations is vital for interpreting the survey’s findings accurately.
By highlighting these dynamics and figures, the CFS provides a window into the intricate world of freight logistics in the United States, offering insights that can influence economic planning, transportation policy, and business strategies across various sectors. For those interested in more details, further information and methodologies can be found on the official Commodity Flow Survey website.


